AWS EKS – Part 17 – Enable Cluster Logging with CloudWatch
Infrastructure logging is an essential topic for any system, and when it comes to AWS, especially EKS, we face different logs from various sources. AWS does not enable logging for EKS clusters but provides an easy way to capture some logs. Before explaining how to enable logging for EKS clusters, let’s talk about the type of logs we have in Kubernetes and know which ones are covered by the AWS logging, the CloudWatch service.
Follow our social media:
https://www.linkedin.com/in/ssbostan
https://www.linkedin.com/company/kubedemy
https://www.youtube.com/@kubedemy
Register for the FREE EKS Tutorial:
If you want to access the course materials, register from the following link:
Register for the FREE AWS EKS Black Belt Course
Log types in Kubernetes environments:
- Component Logs: Logs of each Kubernetes component like kube-scheduler.
- Audit Logs: Logs of the sequence of actions that happened in the cluster.
- Event Logs: Logs of Kubernetes events that occurred in the cluster.
- Application Logs: Logs of any individual apps deployed to the cluster.
- Authenticator Logs: Logs of communications to EKS through IAM credentials.
- Worker Logs: Logs of the worker node, SSH logins, journal, etc.
- Network Logs: Logs of network traffic, ingress/egress, in/out of cluster.
Right now, EKS supports the following logs in a managed “as a service” manner:
- Component Logs: kube-apiserver, kube-scheduler and kube-controller-manager.
- Audit Logs: Users, Groups and principals that have affected the cluster.
- Authenticator Logs: Accesses that occurred to the cluster using IAM credentials.
Each EKS cluster has a separate log group in CloudWatch Logs, and all cluster logs will be sent as log streams to the log group. For each Kubernetes component, there is a separate log stream. Log groups don’t have retention by default and must be added by the user after configuring logging for EKS clusters.
EKS Cluster Logging setup procedure:
- Setup new EKS cluster with logging enabled.
- Enable logging for an existing EKS cluster.
- Check CloudWatch log groups and log streams.
- Run queries in CloudWatch logging system.
Step 1 – Setup new EKS cluster with logging:
To learn more about how to deploy EKS clusters, read the following articles. In this step, we deploy a cluster with all logging types enabled to collect all cluster logs.
AWS EKS – Part 2 – Deploy managed cluster control plane
AWS EKS – Part 12 – Deploy fully air-gapped EKS clusters without internet
aws eks create-cluster \
  --name kubedemy \
  --role-arn arn:aws:iam::231144931069:role/Kubedemy_EKS_Cluster_Role \
  --resources-vpc-config subnetIds=subnet-0ff015478090c2174,subnet-01b107cea804fdff1,subnet-09b7d720aca170608,endpointPublicAccess=true,publicAccessCidrs=0.0.0.0/0 \
  --kubernetes-network-config serviceIpv4Cidr=172.20.0.0/16,ipFamily=ipv4 \
  --logging '{"clusterLogging":[{"types":["api","audit","authenticator","controllerManager","scheduler"],"enabled":true}]}' \
  --kubernetes-version 1.28 \
  --tags owner=kubedemy
Step 2 – Enable Logging on an existing cluster:
To enable cluster logging, logs supported by EKS, run the following command:
aws eks update-cluster-config \
  --name kubedemy \
  --logging '{"clusterLogging":[{"types":["api","audit","authenticator","controllerManager","scheduler"],"enabled":true}]}'
Step 3 – CloudWatch Logs for EKS Cluster:
After enabling logging, you can find the cluster log group in CloudWatch Logs.
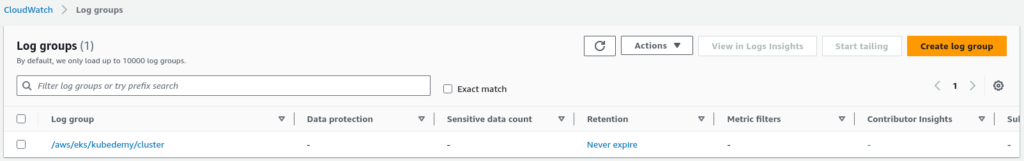
The cluster log group consists of scores of Kubernetes components’ log streams.
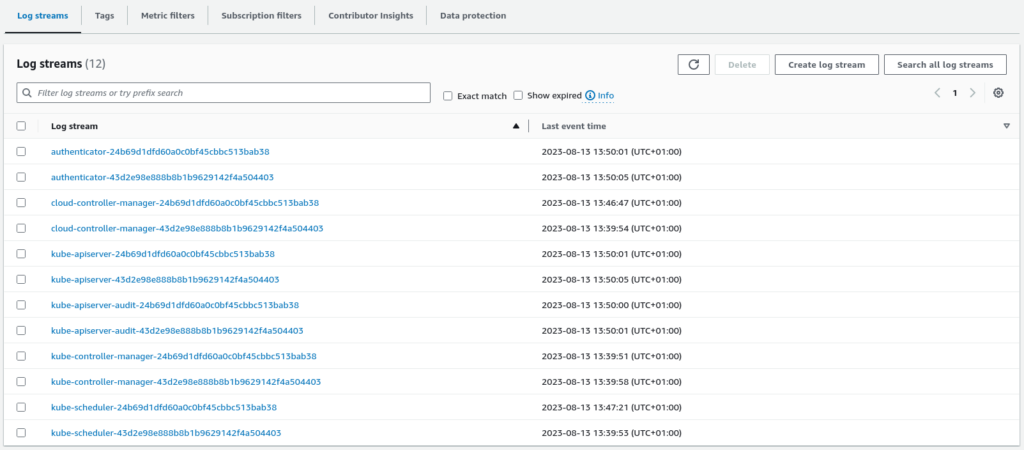
As be seen, we have at least two log streams for each component, which means these components are deployed highly available, as explained in previous articles.
Step 4 – Run CloudWatch Queries for EKS Cluster:
OK, as we have logs, we can watch, search, query and even make alarms.
To run queries, go to the Log Insights dashboard in CloudWatch Logs and run the following query to get all events/actions that happened in kube-system namespace. Of course, it’s just an example, and you can run anything you want.
fields @timestamp, @message
| sort @timestamp desc
| filter objectRef.namespace like 'kube-system'
Conclusion:
Observability is one of the most important topics in infrastructure. When it comes to Kubernetes, it’s so challenging as you must setup many things to get different types of logs, monitor metrics, distribute tracing, etc. In this article, I explained how to collect all logs natively supported by AWS, and in future articles, I will teach you how to collect other log types and monitor Kubernetes with Loki, Grafana, Fluentbit and Prometheus.
If you like this series of articles, please share them and write your thoughts as comments here. Your feedback encourages me to complete this massively planned program. Just share them and provide feedback. I’ll make you an AWS EKS black belt.
Follow my LinkedIn https://www.linkedin.com/in/ssbostan
Follow Kubedemy LinkedIn https://www.linkedin.com/company/kubedemy
Follow Kubedemy Telegram https://telegram.me/kubedemy
Related Posts
AWS EKS – Part 3 – Deploy Worker Nodes using Managed Nodegroups
AWS EKS – Part 2 – Deploy Cluster Control Plane